What does a Closed-End Fund’s Leverage Actually Cost? Achilles Heel or Investor’s Salvation?
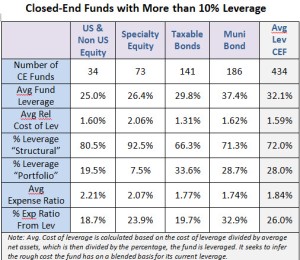
 In our experience, leverage for closed-end funds is often touted as either their salvation or an Achilles Heel. We believe the ability for funds to borrow at long-term rates and invest in the shorter-term is still a powerful benefit to closed-end fund investors. CEFA has been working hard this year to collect and organize data on the various types of CEF leverage as well as the average “cost” per fund for their use of leverage. In a few months we plan to include a CEF’s leverage cost trend in order to identify funds with rising costs for borrowing money vs. those funds whose costs have either stayed stable or lowered over time. In this article, we wanted to shed some light on the current cost of leverage for the main four groups of CEFs and have compiled the following data to help us do that.
CEFA tracks 594 current closed-end funds, as of our March 7, 2014 CEF Universe Report; 112 (19%) of these funds have no leverage employed while 49 (8.3%) have between 1% and 10% leverage employed. The remaining 434 funds have an average of 32% leverage. This is where we focused our review.
Conclusion: It is not surprising that equity funds generally employ less leverage than bond funds as they can have the benefit of capital appreciation as a bigger component of their expected total return compared with the typical bond CE fund, which generally seek to collect income from bonds and avoid defaults.
With an average inferred interest cost for leverage of only 1.59%, investors should continue to see the potential benefits of a leverage closed-end fund. It is true that leverage magnifies return (positive and negative) as well as the volatility of the portfolio; however, we feel it is worth it for the higher amount of income and potential upside it gives most shareholders. We hear some people complain that CEFs have higher expense ratios than index-based ETFs. However, we feel that if you average 1% in expenses for active management, which is not abnormal in an area with average assets for a levered CEF at $430M, and 0.51% as the average impact on the CEF’s leverage cost on NAV (from our data, but not included in the table above), this leaves about 0.33% in fund operating costs. While we understand lower costs can be a benefit for investors, we often review and rate funds on NAV total return performance, which is a manager’s investment results after the cost of his work, a fund’s operating cost and the cost of leverage. NAV total returns continue to be favorable vs. open-end funds across most of the leveraged closed-end fund sectors.
Closed-end fund leverage can be classified as either structural leverage or portfolio leverage. Structural leverage, which is the most common type, affects a CEF’s capital structure by increasing the fund’s portfolio size. The types of structural leverage include the borrowing or issuing debt and preferred stock. Preferred stock accounts for the majority of closed-end fund structural leverage. Portfolio leverage is leverage that results from a portfolio’s investments. Some of the types of portfolio leverage include derivatives, reverse repurchase agreements, and tender option bonds.
In our experience, when a CEF is leveraged, you need to understand what the cost of the leverage is on the portfolio and what the manager is using the leverage for. Then you can decide if you want to be a shareholder of the fund. With the ability to trade a CEF during trading hours at market prices, you are always able to sell when you decide on a better option for your needs. We have long suggested that ETFs are low-cost exposure vehicles and CEFs are a way to capture yield, good active management and the alpha of inefficient pricing. Try to buy at a historically wide discount and sell at either a narrower discount or a premium.
We do not feel that ETFs and CEFs compete directly as they both serve important roles in the US capital markets. CEFs have traded in the US for over 120 years and we look forward to a bright future of new ideas on how to best utilize permanent capital in a liquid format for investors. In our experience, all investment structures have both strengths and weakness. The key, in our opinion, is to know the weaknesses and to learning how to navigate around them for the opportunity for investment success.


Comments are closed.